Can I set a lower corner frequency for the lowpass filter in the laser lock box?

Written by Paul Cracknell
Updated at July 23rd, 2024
-
Moku:Go
Moku:Go General Moku:Go Arbitrary Waveform Generator Moku:Go Data Logger Moku:Go Digital Filter Box Moku:Go FIR Filter Builder Moku:Go Frequency Response Analyzer Moku:Go Logic Analyzer & Pattern Generator Moku:Go Oscilloscope & Voltmeter Moku:Go PID Controller Moku:Go Spectrum Analyzer Moku:Go Waveform Generator Moku:Go Power Supplies Moku:Go Lock-in Amplifier Moku:Go Time & Frequency Analyzer Moku:Go Laser Lock Box Moku:Go Phasemeter
-
Moku:Lab
Moku:Lab General Moku:Lab Arbitrary Waveform Generator Moku:Lab Data Logger Moku:Lab Digital Filter Box Moku:Lab FIR Filter Builder Moku:Lab Frequency Response Analyzer Moku:Lab Laser Lock Box Moku:Lab Lock-in Amplifier Moku:Lab Oscilloscope Moku:Lab Phasemeter Moku:Lab PID Controller Moku:Lab Spectrum Analyzer Moku:Lab Time & Frequency Analyzer Moku:Lab Waveform Generator Moku:Lab Logic Analyzer/Pattern Generator
-
Moku:Pro
Moku:Pro General Moku:Pro Arbitrary Waveform Generator Moku:Pro Data Logger Moku:Pro Frequency Response Analyzer Moku:Pro Oscilloscope Moku:Pro PID Controller Moku:Pro Spectrum Analyzer Moku:Pro Waveform Generator Moku:Pro Lock-in Amplifier Moku:Pro Laser Lock Box Moku:Pro Digital Filter Box Moku:Pro FIR Filter Builder Moku:Pro Phasemeter Moku:Pro Multi-instrument Mode Moku:Pro Logic Analyzer/Pattern Generator Moku:Pro Time & Frequency Analyzer
- Python API
- MATLAB API
- Arbitrary Waveform Generator
- Data Logger
- Digital Filter Box
- FIR Filter Builder
- Frequency Response Analyzer
- Laser Lock Box
- Lock-in Amplifier
- Oscilloscope
- Phasemeter
- PID Controller
- Spectrum Analyzer
- Time & Frequency Analyzer
- Waveform Generator
- Logic Analyzer & Pattern Generator
- Multi Instrument Mode
- Moku Cloud Compile
- Moku general
- LabVIEW
Moku:Lab laser lock box uses a 2-stage second-order IIR filter. In the iPad app, the filter defaults to 1-stage or 2-stage second-order filter only. As we have a limited number of bits during the calculation, this limited us to a ~1 kHz corner. In order to get a filter with a lower corner frequency, it is possible to manually load a 2-stage first-order filter, which should work at or below 1 Hz.
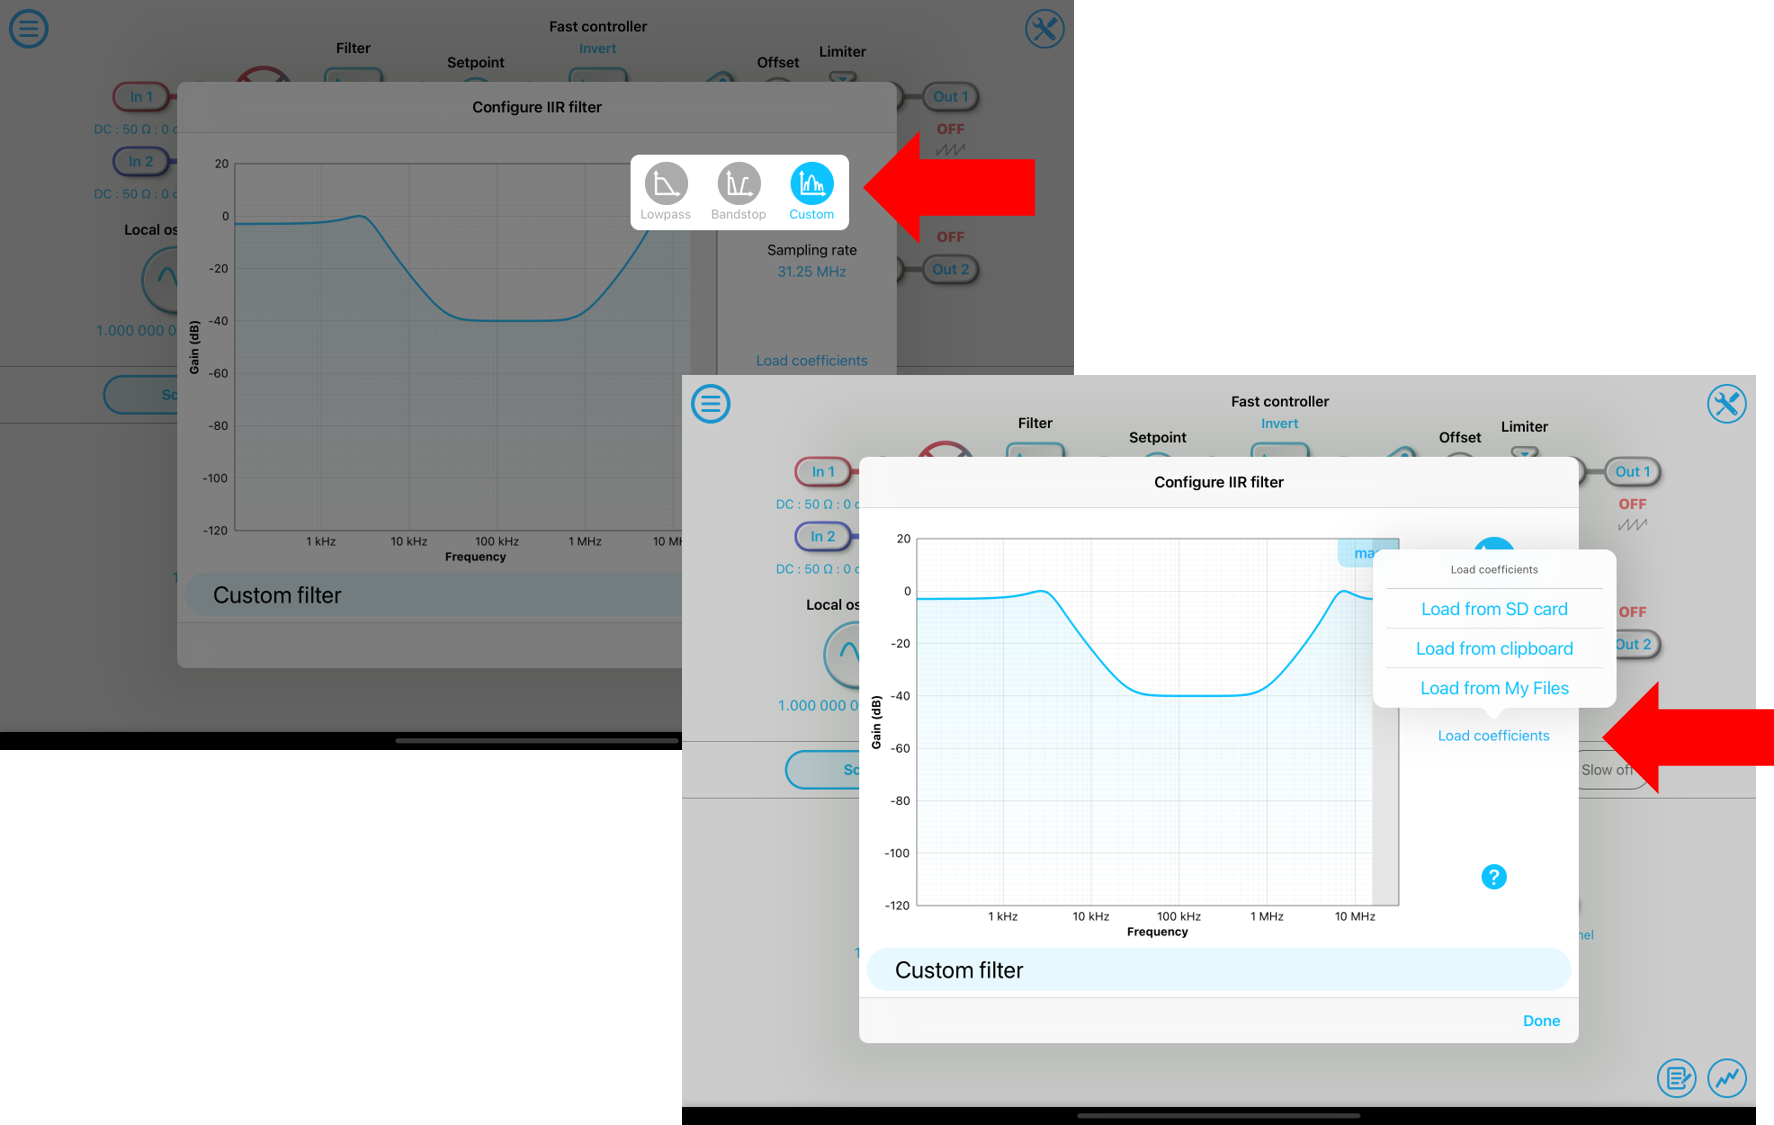
To manually load a custom filter, select the custom filter type in the filter configurator, and then load the filter coefficients from a .txt file in the SD card, clipboard, or My Files, as shown in the screenshot below.
The .txt file should have two rows, six columns with the following format:
| s1 | b0.1 | b1.1 | b2.1 | a1.1 | a2.1 |
| s2 | b0.2 | b1.2 | b2.2 | a1.2 | a2.2 |
s1 and s2 refer to the overall gain for stage 1 and stage 2. bx.1 to ax.1 represent the filter coefficients for stage 1, and bx.2 to ax.2 represent the filter coefficients for stage 2. These filter coefficients can be generated by Python scipy or MATLAB with Signal Processing Toolbox. Here, we provide a Python script to generate the .txt file.
import numpy as np
import matplotlib.pyplot as plt
from scipy import signal
import math


def main():
corner_frequency = 1 #in Hz
filter_type = 1 #1 for first order 2-stage, 2 for second order 1-stage
generate_filter_array(corner_frequency,filter_type, plot = False)

def generate_filter_array(corner_frequency,filter_order,plot):
sample_rate = 31.25e6
normalised_corner = corner_frequency / (sample_rate / 2)
if filter_order == 1:
b, a = signal.butter(1, normalised_corner, 'low', analog = False)
a = np.append(a,0)
b = np.append(b,0)
gen_coe_array(b, a, filter_order,str(corner_frequency)+'Hz'+str(filter_order)+'order_filter')
if plot == True:
plot_fra(b,a,filter_order)
elif filter_order == 2:
b, a = signal.butter(2, normalised_corner, 'low', analog = False)
gen_coe_array(b,a,filter_order,str(corner_frequency)+'Hz'+str(filter_order)+'order_filter')
if plot == True:
plot_fra(b,a,filter_order)


def plot_fra(b,a,order):
w, h = signal.freqz(b, a, worN = 2048*2048)
if order == 1:
h = np.multiply(h,h)
plt.semilogx(w*sample_rate/math.pi/2, 20 * np.log10(np.absolute(h)))
plt.title('Butterworth filter frequency response')
plt.xlabel('Frequency [Hz]')
plt.ylabel('Amplitude [dB]')
plt.grid(which='both', axis='both')
plt.show()

def gen_coe_array(b,a,order,name):
if order == 1:
coefficient_array = [[1.0, b[0], b[1], 0, a[1], 0],
[1.0, b[0], b[1], 0, a[1], 0]]
elif order == 2:
coefficient_array = [[1.0, b[0], b[1], b[2], a[1], a[2]],
[1.0, 1.0, 0.0, 0.0, 0.0, 0.0]]
np.savetxt(name +'.txt',coefficient_array, delimiter = ',')


if __name__ == '__main__':
main()