What is the shading and line in the Data Logger?

Written by Sam Speece
Updated at October 27th, 2024
-
Moku:Go
Moku:Go General Moku:Go Arbitrary Waveform Generator Moku:Go Data Logger Moku:Go Digital Filter Box Moku:Go FIR Filter Builder Moku:Go Frequency Response Analyzer Moku:Go Logic Analyzer & Pattern Generator Moku:Go Oscilloscope & Voltmeter Moku:Go PID Controller Moku:Go Spectrum Analyzer Moku:Go Waveform Generator Moku:Go Power Supplies Moku:Go Lock-in Amplifier Moku:Go Time & Frequency Analyzer Moku:Go Laser Lock Box Moku:Go Phasemeter
-
Moku:Lab
Moku:Lab General Moku:Lab Arbitrary Waveform Generator Moku:Lab Data Logger Moku:Lab Digital Filter Box Moku:Lab FIR Filter Builder Moku:Lab Frequency Response Analyzer Moku:Lab Laser Lock Box Moku:Lab Lock-in Amplifier Moku:Lab Oscilloscope Moku:Lab Phasemeter Moku:Lab PID Controller Moku:Lab Spectrum Analyzer Moku:Lab Time & Frequency Analyzer Moku:Lab Waveform Generator Moku:Lab Logic Analyzer/Pattern Generator
-
Moku:Pro
Moku:Pro General Moku:Pro Arbitrary Waveform Generator Moku:Pro Data Logger Moku:Pro Frequency Response Analyzer Moku:Pro Oscilloscope Moku:Pro PID Controller Moku:Pro Spectrum Analyzer Moku:Pro Waveform Generator Moku:Pro Lock-in Amplifier Moku:Pro Laser Lock Box Moku:Pro Digital Filter Box Moku:Pro FIR Filter Builder Moku:Pro Phasemeter Moku:Pro Multi-instrument Mode Moku:Pro Logic Analyzer/Pattern Generator Moku:Pro Time & Frequency Analyzer
- Python API
- MATLAB API
- Arbitrary Waveform Generator
- Data Logger
- Digital Filter Box
- FIR Filter Builder
- Frequency Response Analyzer
- Laser Lock Box
- Lock-in Amplifier
- Oscilloscope
- Phasemeter
- PID Controller
- Spectrum Analyzer
- Time & Frequency Analyzer
- Waveform Generator
- Logic Analyzer & Pattern Generator
- Multi Instrument Mode
- Moku Cloud Compile
- Moku general
- LabVIEW
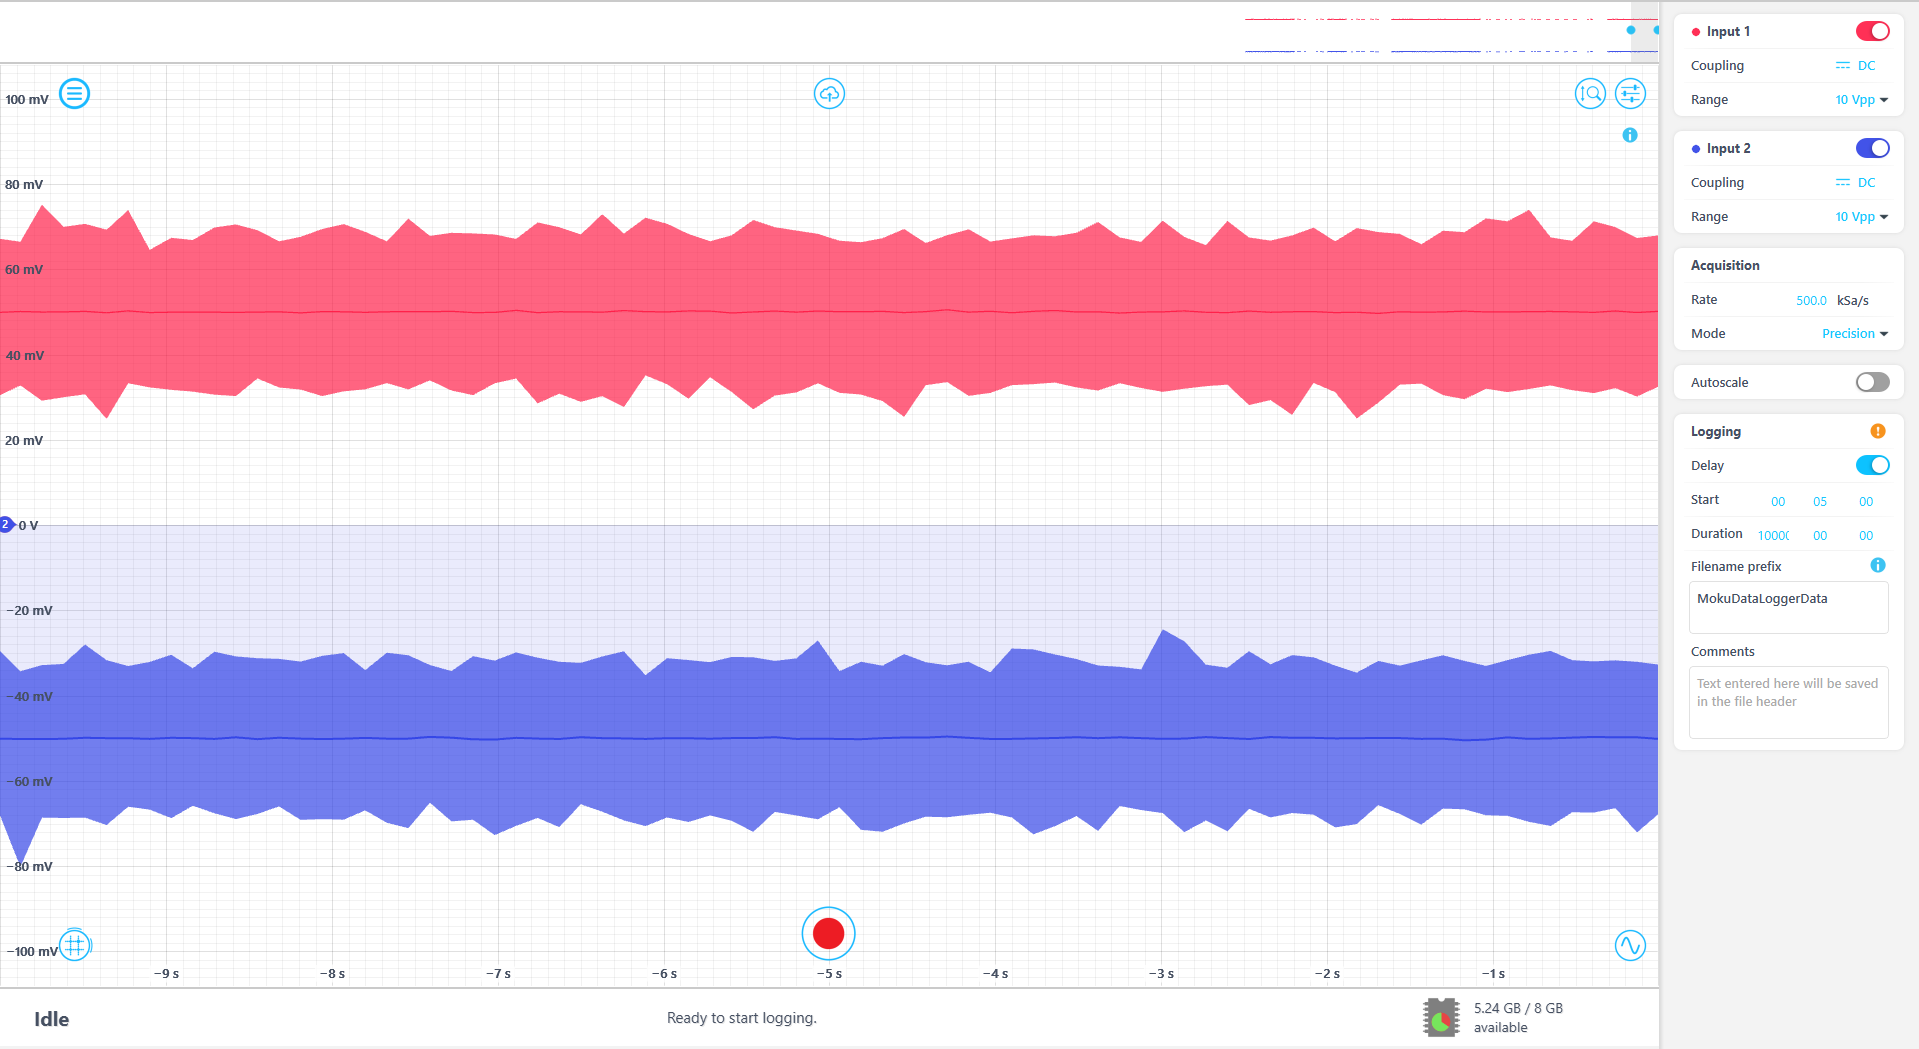
Similar to the Oscilloscope, the active channels shown in the Moku App have a darker line trace that denotes the amplitude and the shaded area below it is the area under the curve. In the picture below, both channels are active in the Data Logger for the logging session.
The Data Logger graph window is limited to a span of a 10 seconds. This means that the graph window is not well suited for viewing short signals, like pulses. For example, if I wanted to log a 10 kHz pulse for 10 seconds, the Data Logger graph window would look similar to the figure below. It is hard to tell what the actual signal looks like due to the large span, but the logging rate is above 100 kSa/s, so the data being logged will be accurately graphed in something like MATLAB.
You may also notice that the dark trace for the selected channel is covering a range of a few millivolts to tens of millivolts. This is because the acquisition mode is set to Normal, which downsamples the ADC data. Changing the acquisition mode to Precision will improve accuracy.